

TL;DR:
- A cycling risk assessment identifies hazards, estimates their likelihood, and guides gear choices for safety. The higher the risk score, the more protective equipment, such as full-face helmets and dashcams, becomes necessary. Regularly re-evaluating routes and matching gear to risk levels enhances rider safety and preparedness.
A cycling risk assessment is a structured process of identifying hazards on your route, estimating how likely each one is to cause harm, and deciding which protective gear and behaviors will reduce that risk most. Run one before any new ride and the gear decision almost makes itself:
- Low risk (quiet paths, low traffic, familiar routes): a commuter helmet with front and rear lights
- Medium risk (urban streets, moderate traffic, intersections): a MIPS-certified helmet, handlebar or glasses-mounted mirror, and high-lumen lights
- High risk (downhill, fast arterials, heavy truck traffic, low visibility): a full-face MIPS integral helmet, AI rear-view dashcam, and maximum-visibility gear
The rest of this guide walks through the method, the evidence, and the exact gear that matches each level.
Table of Contents
- What a cycling risk assessment actually covers
- How to run your own probability × consequence assessment
- The hazards US cyclists most commonly face
- Translating risk levels into specific gear
- How Thebeamofficial’s products map to your assessment results
- Your pre-ride cycling risk checklist
- What a personal assessment cannot do
- Key Takeaways
- Why most cyclists skip the most important step
- Gear matched to your assessment: Thebeamofficial’s range
- Useful sources and further reading
What a cycling risk assessment actually covers
A cycling safety assessment looks at five components: hazard identification, probability estimate, consequence estimate, risk level assignment, and mitigation priorities. Together they answer one question: if something goes wrong here, how bad could it get, and how likely is it?
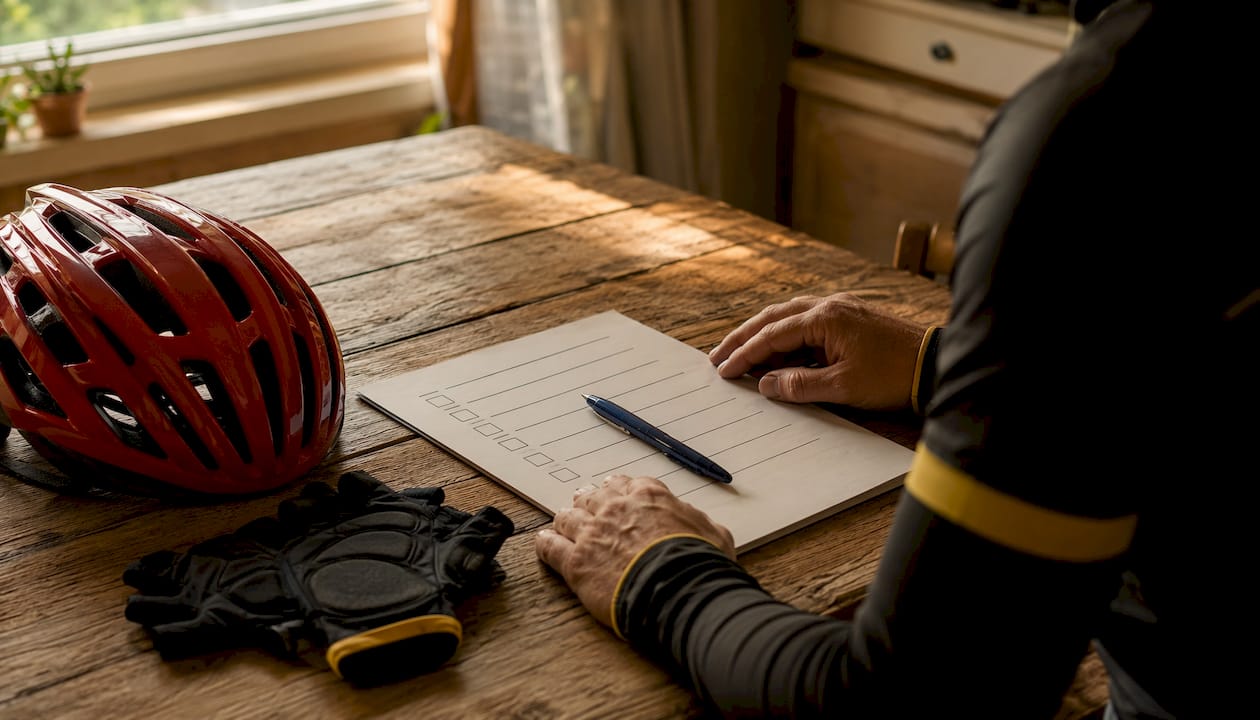
Two established frameworks shape how professionals approach this. CycleRAP evaluates road infrastructure attributes to estimate crash risk without needing historical crash data, scoring streets from low to extreme based on traffic speed, junction design, and surface quality. Bikeability adds a user-comfort layer that CycleRAP skips, covering how rideable a route feels. A 2024 MDPI comparative study found the two tools produce correlated safety scores but measure different things. The safest approach uses both: CycleRAP to flag objectively dangerous segments, Bikeability to flag segments that feel uncomfortable and therefore invite risky behavior.
A personal assessment typically covers:
- Junction count and type (signalized vs. uncontrolled)
- Traffic volume and vehicle mix (cars, trucks, buses)
- Surface condition (potholes, gravel, wet pavement)
- Visibility (lighting, sight lines, weather)
- Rider fatigue and load (cargo, e-bike weight)
- Weather forecast and seasonal conditions
How to run your own probability × consequence assessment
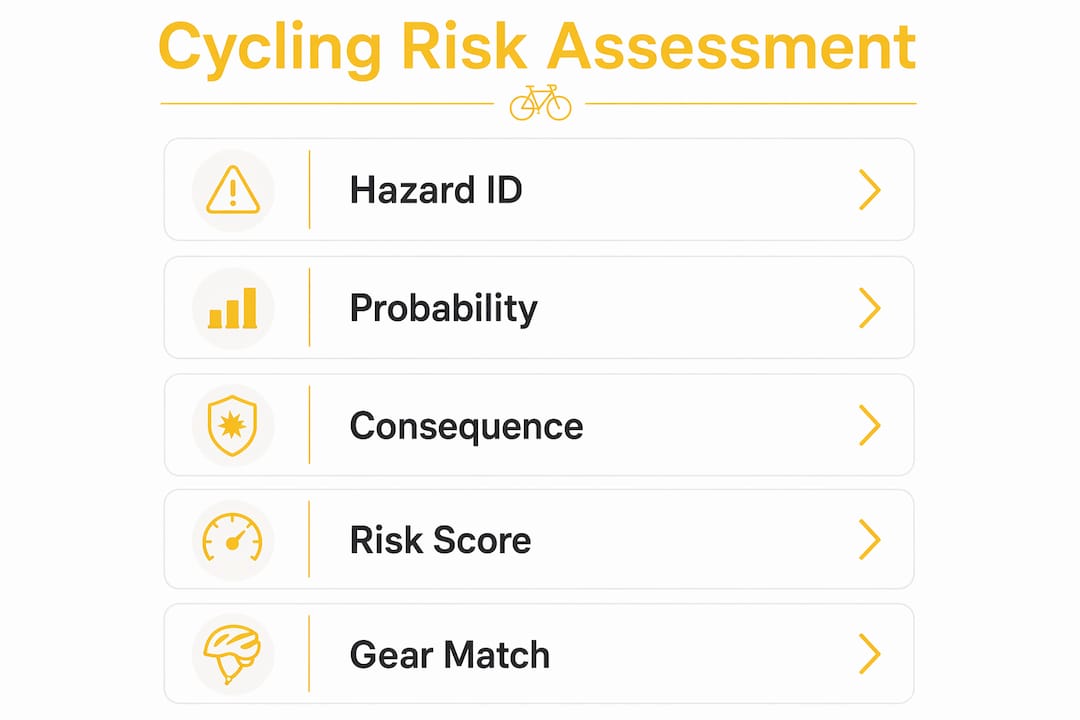
A validated MDPI risk-index methodology groups 19 risk factors into four categories: facility, infrastructure, rider behavior/demographics, and weather/traffic. You do not need all 19 for a personal pre-ride check. An 8–12 item version works well.
Step-by-step method
- Map your route — note every junction, high-speed section, and surface change.
- List hazards — for each segment, write down what could go wrong (turning truck, pothole, blind corner).
- Score probability — rate each hazard 1 (unlikely), 2 (possible), or 3 (likely) based on time of day, traffic, and your experience on that road.
- Score consequence — rate severity 1 (minor scrape), 2 (injury requiring care), or 3 (serious or fatal injury).
- Plot on the matrix below — multiply the two scores to get a risk number.
- Prioritize — address anything scoring 6 or above before you ride.
3×3 probability × consequence risk matrix
| Consequence 1 (Minor) | Consequence 2 (Moderate) | Consequence 3 (Severe) | |
|---|---|---|---|
| Probability 1 (Unlikely) | 1 — Low | 2 — Low | 3 — Medium |
| Probability 2 (Possible) | 2 — Low | 4 — Medium | 6 — High |
| Probability 3 (Likely) | 3 — Medium | 6 — High | 9 — High |
Scores 1–2: low risk, standard commuter gear. Scores 3–4: medium risk, add MIPS and active visibility. Scores 6–9: high risk, full-face helmet and rear-view recording.
Pro Tip: Score junctions separately from open road segments. A quiet suburban street can have a single high-consequence junction that pushes the whole route into medium or high territory.
Run this assessment before any new route, after an incident, and whenever the season changes. Dynamic re-evaluation during a ride — adjusting your speed or lane position when unexpected conditions appear — is the step most riders skip entirely.
The hazards US cyclists most commonly face
Junction behavior drives the majority of serious urban incidents. RoSPA data shows “failed to look properly” is the most common contributory factor in vehicle-cyclist collisions at junctions, attributed to drivers in 57% of serious collisions and to cyclists in 43%. Separately, heavy goods vehicles are involved in roughly 20% of cyclist fatalities, most often during turns at junctions.
For US riders, the most consequential hazards break down like this:
- Turning vehicles at intersections — the dominant urban threat; a truck’s blind spot during a right turn is the highest-consequence scenario most commuters face
- Potholes and surface defects — especially after winter freeze-thaw cycles; a sudden swerve into traffic is often more dangerous than the pothole itself
- Low visibility conditions — dawn, dusk, rain, and tunnel underpasses where drivers adjust late
- High-speed arterials — suburban roads with 40–50 mph traffic and no protected lane
- Distracted riding — headphones, phone use, and fatigue reduce a rider’s own hazard detection
Urban commuters face junction-heavy routes where visibility gear and mirrors matter most. Gravel and trail riders face surface and weather hazards where helmet coverage and retention matter more. Downhill riders face high-consequence, high-speed scenarios where full-face protection is non-negotiable.
Translating risk levels into specific gear
Your risk score should drive your gear selection as directly as a prescription drives a medication choice. The table below maps assessed risk to the equipment that addresses it.
| Risk level | Riding context | Recommended gear | Key features to look for | US price range |
|---|---|---|---|---|
| Low | Quiet paths, familiar commute | Open-face helmet, front/rear lights | CPSC certification, basic retention | $50 |
| Medium | Urban streets, moderate traffic | MIPS open-face helmet, mirror, 200+ lumen lights | MIPS liner, wide field-of-view mirror, beam pattern | $150 |
| High | Downhill, fast arterials, HGV routes | Full-face MIPS integral helmet, AI dashcam, high-vis vest | Full-face coverage, MIPS, 1000+ lumen front, rear recording | $350 |
For medium and high-risk rides, a cycling safety gear guide can help you match specific products to the features above. Key checklist items when shopping:
- Helmet: MIPS liner confirmed, coverage type (open vs. full-face), retention system (dial-fit preferred), weight
- Lights: front lumen output, rear flash mode, battery life, daytime running mode
- Mirror: field of view angle, vibration stability, bar-end vs. glasses-mount
- Dashcam: rear-facing recording, junction event detection, loop recording, battery or USB-C charging
How Thebeamofficial’s products map to your assessment results
Thebeamofficial builds its product line around exactly the risk-level progression described above. The flagship VIRGO integral helmet with MIPS technology is designed for high-risk riding contexts: full-face coverage, MIPS impact liner, and a retention system built for downhill and fast urban exposure. For riders whose assessment puts them in the high-risk band, the VIRGO addresses every checklist item in the table above.
For medium-risk urban commuters, Thebeamofficial’s handlebar and glasses-mounted rear-view mirrors extend your hazard detection at junctions without requiring you to turn your head in traffic. The AI-powered rear-view dashcam records junction interactions continuously, which is directly relevant given that most serious urban incidents occur at or near junctions.
The VIRGO integral helmet with MIPS is Thebeamofficial’s answer to high-consequence riding: full-face protection, MIPS technology, and a retention system designed for riders who have done the math on their risk exposure and chosen not to compromise.
Thebeamofficial ships to the United States, and the full range of helmets, mirrors, dashcams, and lighting accessories is available through their e-commerce platform. For riders moving from low to medium risk, the mirrors and lights are the fastest upgrade. For anyone scoring 6–9 on the matrix, the VIRGO is the logical next step.
Your pre-ride cycling risk checklist
Score each item 0 (no concern), 1 (minor concern), or 2 (significant concern). Add your scores.
- Route junction count: 0–3 junctions (0), 4–7 (1), 8+ (2)
- Traffic volume: light (0), moderate (1), heavy with trucks (2)
- Surface condition: smooth (0), some defects (1), potholes/gravel (2)
- Visibility: daylight/clear (0), dawn/dusk (1), dark/rain (2)
- Weather: dry (0), light wind/cloud (1), rain/ice/fog (2)
- Rider readiness: rested (0), slightly fatigued (1), tired or carrying load (2)
Scoring thresholds:
- 0–4 (Low): Standard gear, normal pace
- 5–8 (Medium): Activate lights, check mirror, consider alternate route
- 9–12 (High): Full-face helmet, dashcam on, high-vis layer, reduce speed at every junction
What a personal assessment cannot do
A personal cycling risk assessment reduces risk. It does not eliminate it. A few hard limits worth knowing:
- Helmet standards: In the US, the Consumer Product Safety Commission (CPSC) sets the mandatory standard for bicycle helmets. Any helmet you buy should carry CPSC certification as a baseline. MIPS is an additional impact-liner technology, not a certification standard.
- Self-assessment limits: You cannot predict driver behavior. Your assessment improves your preparation, not your control over other road users.
- When to seek professional assessment: High-speed downhill tracks, sanctioned race events, and employer-organized work rides benefit from a structured professional risk assessment that goes beyond personal scoring.
- State variation: Helmet laws, e-bike classifications, and road-use rules vary by state. Check your state’s DMV or transportation department for current requirements.
This article is general safety information, not professional legal or medical advice. Confirm current regulations with your state’s relevant authority before riding.
Key Takeaways
A cycling risk assessment converts hazard identification and probability × consequence scoring into a direct gear decision: the higher your score, the more protective your helmet and accessories need to be.
| Point | Details |
|---|---|
| Run the matrix before new routes | Score each hazard by probability × consequence; anything scoring 6+ requires upgraded gear. |
| Junctions are the priority hazard | RoSPA data links 57% of serious junction collisions to driver inattention and 43% to cyclist inattention; mirrors and dashcams address this directly. |
| Match helmet type to risk level | Low risk: open-face CPSC helmet. Medium: MIPS open-face. High: full-face MIPS integral helmet. |
| Reassess dynamically | Re-evaluate mid-ride when weather, traffic, or fatigue changes; static pre-ride scores go stale fast. |
| Thebeamofficial for high-risk riders | The VIRGO integral helmet with MIPS and the AI rear-view dashcam are built for riders scoring in the medium-to-high band. |
Why most cyclists skip the most important step
The risk matrix is not the hard part. Riders fill it in, identify the junction, note the truck route, and then grab the same helmet they have used for three years. The assessment and the gear decision stay disconnected.
What actually changes riding outcomes is the moment you treat a high score as a purchase trigger, not just a mental note. A score of 6 on the matrix means the combination of likelihood and consequence is high enough that your current gear may not be adequate for that specific route. That is not a philosophical point. It is a practical one.
The other thing practitioners underestimate: perceived risk and objective risk diverge most at junctions. A route can feel calm and direct while carrying a genuinely high junction-collision probability. Instrumented bicycle studies confirm that riders consistently underestimate risk at intersections compared to what telemetry and video actually record. That gap is exactly where a rear-view dashcam and a wide-field mirror earn their keep, not on the open road where you can see everything coming.
For newer riders, score conservatively: when in doubt between a 1 and a 2, choose 2. For experienced riders, the temptation is the opposite — familiarity breeds underscoring. A route you have ridden 200 times can still have a new pothole or a changed traffic pattern. The urban cycling protection guide on the Thebeamofficial blog covers this dynamic well for commuters specifically.
Gear matched to your assessment: Thebeamofficial’s range
Once your assessment puts you in the medium or high band, the gear decision is straightforward. Thebeamofficial’s adult helmets collection includes the VIRGO integral helmet with MIPS, built for riders who have scored their routes honestly and want full-face protection without sacrificing fit or weight. For junction-heavy urban commutes, the AI-powered rear-view dashcam records continuously and flags safety-critical events, turning your assessment’s junction risk score into documented, reviewable data.
The full range of mirrors, reflectors, and lighting accessories is available at Thebeamofficial’s accessories store, with US shipping. If your pre-ride checklist is pushing you into medium or high territory, the next step is picking the gear that matches that score. Browse the helmets and accessories, match them to your matrix result, and ride with equipment that reflects what you actually know about your route.
Useful sources and further reading
- CycleRAP infrastructure scoring tool (iRAP) — use this for objective, infrastructure-level route evaluation before planning high-exposure rides
- MDPI: Pedal towards Safety — risk index methodology — the validated probability × consequence framework this article’s method is based on
- MDPI: Bikeability vs. CycleRAP comparative study — explains why combining both tools gives a fuller picture than either alone
- RoSPA cycling risk assessment guidance — structured employer and event-organizer framework with hazard categories
- Cycling UK risk assessment template — printable template for group rides and events
- MDPI: Observed risk and user perception study — instrumented bicycle research on perceived vs. objective risk at junctions
- Thebeamofficial blog — practical safety articles for commuters and road cyclists
Keep a copy of your personal assessment and update it after any incident, a change of route, or at the start of each season. A score from last summer does not account for winter road conditions or new construction on your commute.


